
Competitive Research
Brand Diagnostic Model
Almost every brand knows which attributes buyers say are important. Very few know which of those attributes actually move purchase, and the two sets rarely match.
The Brand Diagnostic Model is an explanatory structural equation model. It uses multivariate statistics to separate what people declare from what their behaviour reveals, and returns a quantified hierarchy of the purchase drivers in your category.
What it is
A map of why people buy in your category
The model tests the relationship between what people buy, what they prefer, how they rate product performance, and the image they attach to each brand. Instead of a list of attributes ranked by what people said, it produces a structure: what feeds what, and how strongly.
- Quantify the category's purchase drivers rather than assuming them.
- Describe the real criteria a consumer uses to choose a brand.
- Establish a benchmark against the consumer's ideal.
- Determine each brand's positioning against its competitors.
- Identify strengths and weaknesses brand by brand, in priority order.
How the decision is modelled
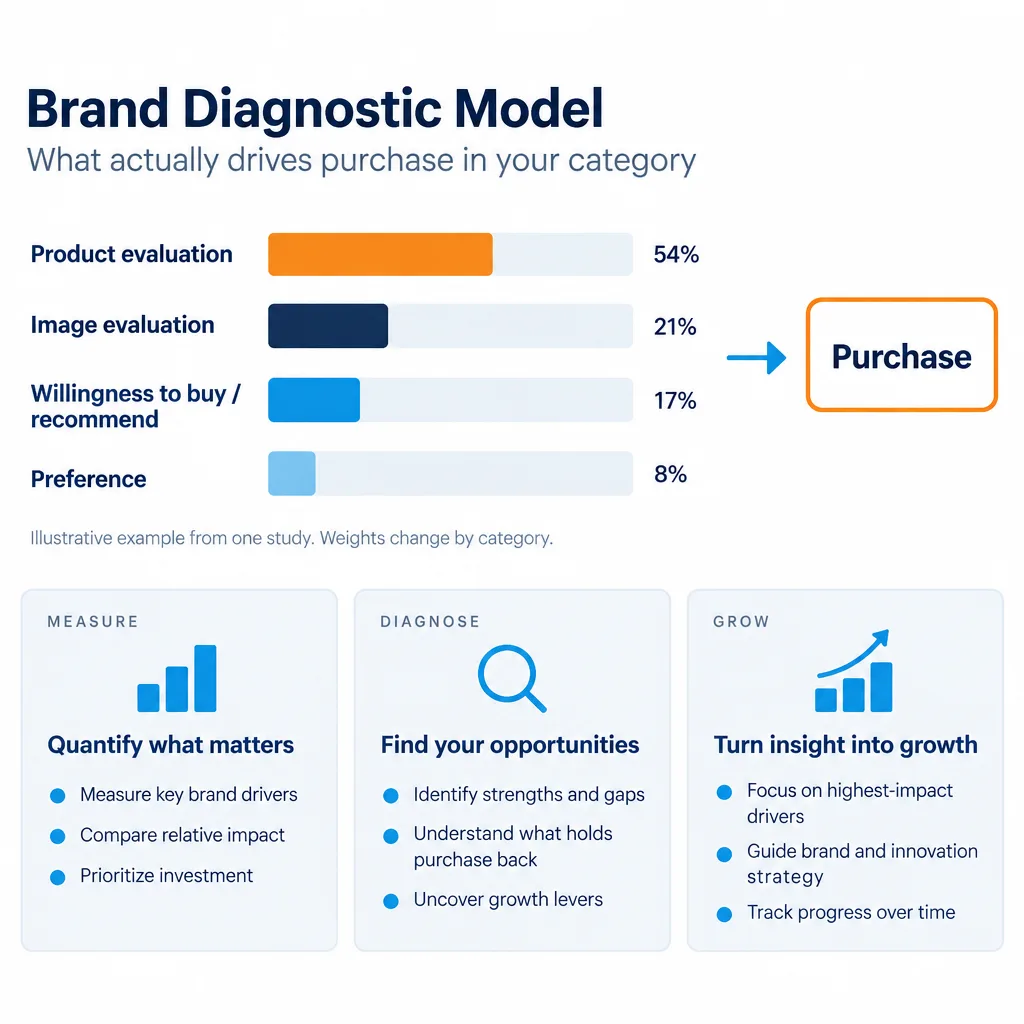
Four forces push purchase. The model measures how much each one weighs.
A purchase decision draws on different criteria, and their relative weight changes entirely which strategy is right for a brand.

Product evaluation
54%
“I buy it because the product is better”
A high weight here favours brands with the best perceived performance on the attributes that matter most in use: effectiveness, practicality, ease of use, sensory attributes.
Willingness to buy / recommend
17%
“From my experience, I would buy it again and recommend it”
A high weight favours brands that deliver more satisfaction in use: high penetration, sustained quality, consistency.

Image evaluation
21%
“I buy it because I like the brand”
A high weight favours brands with stronger emotional ties and an image aligned to what the category expects: quality, tradition, family, innovation, right price, premium.

Preference
8%
“I buy it because it is my favourite”
A high weight favours loyalty to the preferred brand, which benefits category leaders above all.
Note:The weights shown are an illustrative example from one real study; they are not a constant. Quantifying them for your category is precisely what the model does.
That is where the strategic value sits: if image carries twice the weight of product in your category, spending on reformulation before communication is spending in the wrong place. And the reverse.
What it produces
Declared importance versus real relevance
The model measures two different things about every attribute, and the gap between them is usually where the opportunity is.
Declared importance
What the buyer names as important when asked. More important = more present in their mind.
Relevance
How much that attribute actually shifts the overall evaluation of the product — measured, not declared. More relevant = more effective in the evaluation.
Attribute classification
Essential
High importance · High relevance
Cannot be missing. It is the entry price to the category.
Surprising
Low importance · High relevance
Moves evaluation even though nobody mentions it. This is where market opportunity lives.
Expected
High importance · Low relevance
Everyone says it, but it does not differentiate. Competing here is expensive.
Ignored
Low importance · Low relevance
Neither mentioned nor moving the needle. Do not invest here.
Then, brand by brand
Crossing each attribute's relevance with how strongly it is associated to your brand, the model prioritises where to concentrate communication and positioning.
Positive
High association · High relevance
Your real strength. Defend it.
To develop
Low association · High relevance
It matters and you are not credited for it. The biggest communication opportunity.
Spent
High association · Low relevance
You are credited for it but it no longer sells. Stop investing there.
Irrelevant
Low association · Low relevance
Neither associated to you nor important. Ignore it.
The questions it answers
What you leave the study with
Each of these is a question a brand team has to answer before deciding where the year's budget goes.
- What drives purchase in my category?
- A driver map with quantified weights, and the relevance of every attribute.
- Which attributes are necessary, and where can I differentiate?
- Attribute classification across essential, expected, surprising and ignored.
- How are the category's brands positioned?
- A positioning map, and which attributes differentiate each brand.
- How close is my brand to the consumer's ideal?
- Benchmarking against the ideal, attribute by attribute, comparable across brands.
- Where are my strengths, and where are my competitors'?
- Attribute priority per brand: positive, to develop, spent and irrelevant.
Deliverables
What you receive
01
Results report
Presented by a senior researcher in a two-hour working session, not emailed over.
02
Driver hierarchy map
An infographic showing each component's influence on regular category purchase: purchase intent, preference, product performance evaluation and brand image evaluation.
03
Detailed model appendices
Purchase results (willingness, effects and weights), evaluation and image results (associations, correlations, contributions, positioning, benchmarking, attribute classification per brand, attribute importance and relevance) and preference results (weights and ranking).
Methodology
How the data is collected
Descriptive quantitative, using face-to-face interviews of no more than 30 minutes, structured in an Android tablet app running offline.
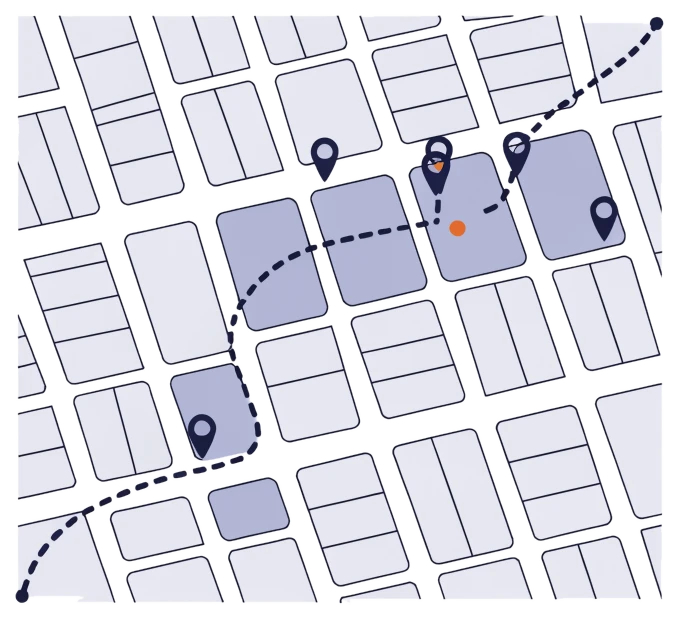
- Random selection of neighbourhoods to build route maps: at most 12 interviews per neighbourhood, 4 per block and 2 per block face, so the sample never concentrates on one street.
- Incident logging for every screener failure, not only for completed interviews.
- Audio recording of every interview, without exception.
- Photographic and GPS record of the interview location.
- Data capture and database entry in the field.
- 24 interviewers, one coordinator per city and one national coordinator.
- Telephone back-checks afterwards as quality control.
Reference sample design
This is the standard design for a national read in Colombia. It is not a fixed template: see the note below.
| City | Stratum 2 | Stratum 3 | Stratum 4 | Total |
|---|---|---|---|---|
| Bogotá | 124 | 124 | 52 | 300 |
| Medellín | 116 | 133 | 51 | 300 |
| Cali | 136 | 139 | 25 | 300 |
| Barranquilla | 139 | 108 | 53 | 300 |
| Total | 515 | 504 | 181 | 1,200 |
Total margin of error: 2.8% · Margin of error per city: 5.7%
Target group
- Men and women aged 25 to 55, resident in socio-economic strata 2, 3 and 4 of the country's main cities.
- Responsible for household purchasing.
- Category buyers within the last 30 days, six months or year, depending on the category.
We aim for a homogeneous sample per city, which can then be weighted to each brand or category's need. If a city or a profile is not of interest, it is dropped or swapped, and that moves the cost, up or down.
Phases and timing
How long it takes
From questionnaire approval to report delivery.
- 0Questionnaire approval—
- 1Script programming on Android tablets2 days
- 2Pilot test and corrections1 day
- 3Survey collection15 days
- 4Quality control and supervision4 days
- 5Analysis and report preparation10 days
Around 32 working days from questionnaire approval.
What brand decision are you facing?
Tell us the category and the decision. A senior researcher will tell you whether the model applies, and if it does not, we will tell you that too.